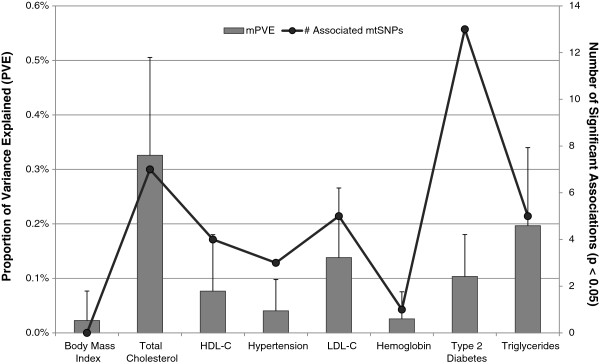
Figure 1.

Correlation of mitochondrial PVE and number of significantly associated mtSNPs. The proportion of variance explained by mitochondrial genetic variation (mPVE), calculated using GCTA, is shown on the primary y-axis (bars shown represent standard error). The secondary y-axis displays the number of significantly associated SNPs observed for each trait, plotted as black dots.
