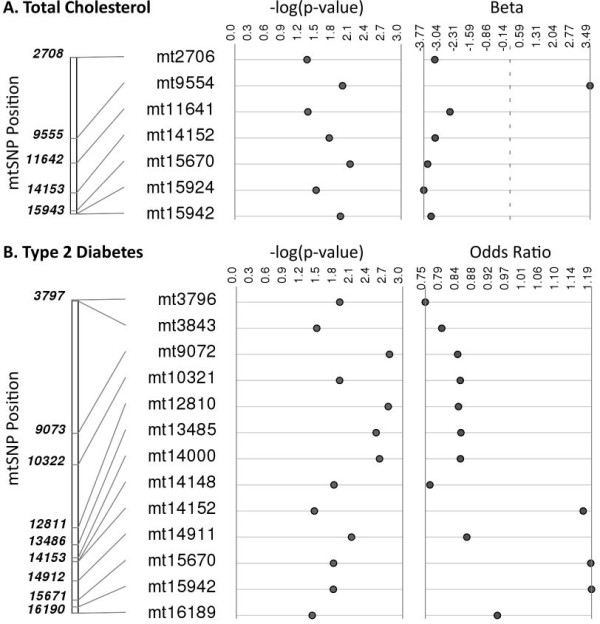
Figure 2.

Mitochondrial SNPs significantly associated with total cholesterol and type 2 diabetes. Regression analyses were performed to identify mtSNPs associated with: (A) total cholesterol and (B) type 2 diabetes (T2D). SNPs reaching the significance threshold of p < 0.05 were plotted using Synthesis-View. The -log10 p-values and effect sizes (beta coefficients for total cholesterol and odds ratios for T2D) are shown, plotted in order of base pair position. The dashed line for the beta coefficient values represents no effect on total cholesterol for a given SNP.
