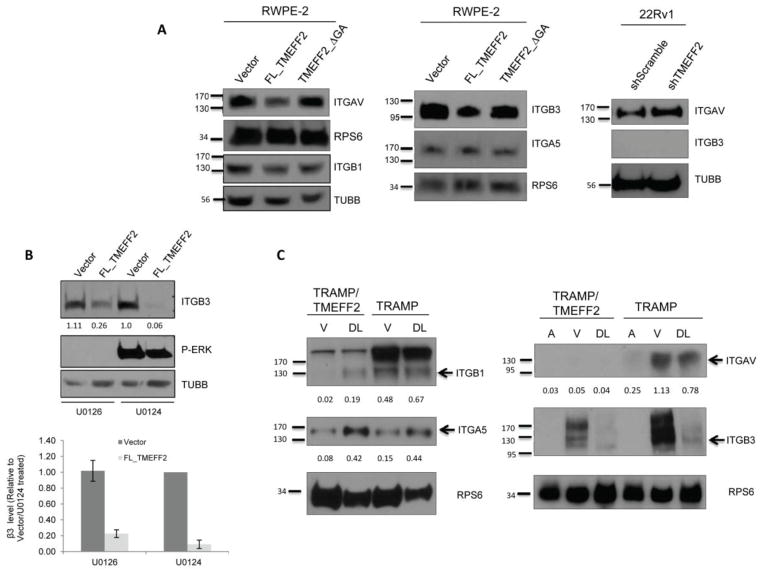
Figure 6.
TMEFF2 modulates the abundance of αv, β1 and β3 integrins in cell lines and in mouse prostates. A) Total lysates of the indicated cells lines were subjected to immunoblotting with antibodies against the integrins as shown. Note that TMEFF2 did not promote changes in α5 integrin levels and that 22Rv1 cells do not express β3 integrin. B) Total lysates of RWPE2 cells treated with 10μM MAPK inhibitor U0126 or inactive analog U0124 for 24 h were subjected to immunoblotting with integrin β3 antibody. The effectiveness of MAPK inhibition was demonstrated using an antibody against phosphorylated ERK. C) Tissue lysates from the anterior (A), ventral (V) or dorsolateral (DL) lobes of the mouse prostate were subjected to immunoblotting with antibodies against the specified integrins. Arrows indicate the sizes of the individual integrin subunits observed in cell lines. Additional bands may represent precursor proteins, which are also decreased by TMEFF2. β-tubulin (TUBB) or ribosomal protein S6 (RPS6) were used as a loading controls. Numbers under the western blots are the densitometry quantifications of the arrow-pointed bands normalized to the loading control using ImageJ. Note that the complexity of the banding pattern for the β3 integrin in mouse prostate lobes did not allow quantification however, the decrease in the abundance as a result of TMEFF2 expression is clear.

