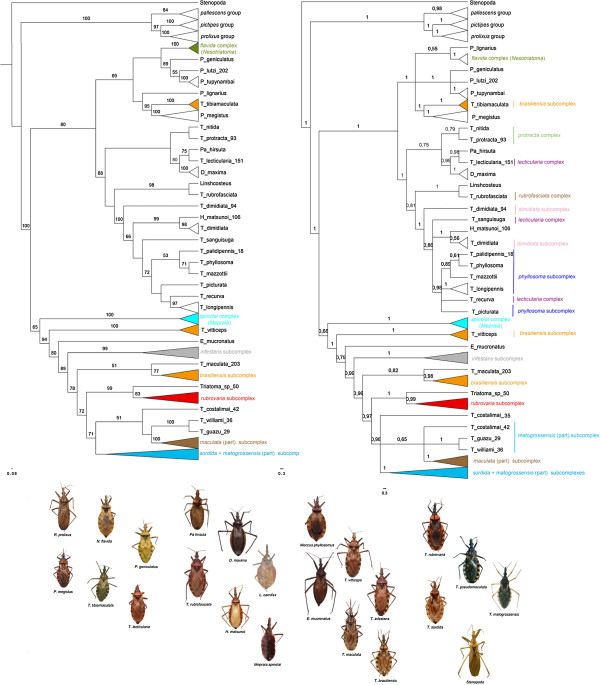
Figure 1.
Best ML tree (on the left) and Bayesian consensus tree (on the right) reconstructed. Bars on the right highlight the non-monophyletic groups. Numbers above branches represent clade support higher than 50 and 0.5, respectively. Triatominae photos by Carolina Dale. Stenopoda spinulosa photo by Brad Barnd. Photos are not to scale.

