
Figure 8.
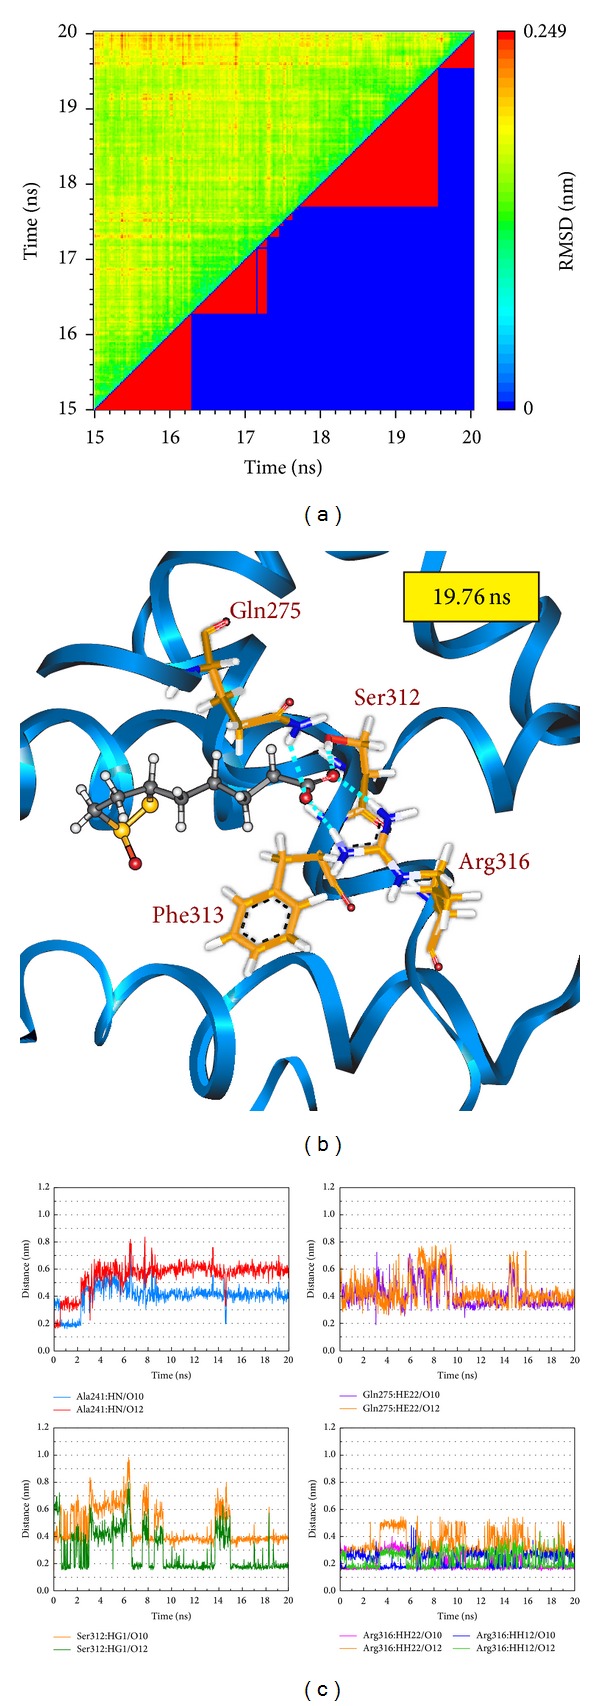
(a) Root-mean-square deviation value (upper left half) and graphical depiction of the clusters with cutoff 0.11 nm (lower right half) for RXR protein complexes with β-lipoic acid. (b) Docking poses of middle RMSD structure in the major cluster for RXR protein complexes with β-lipoic acid. (c) Distances of hydrogen bonds with common residues during 20 ns MD simulation.