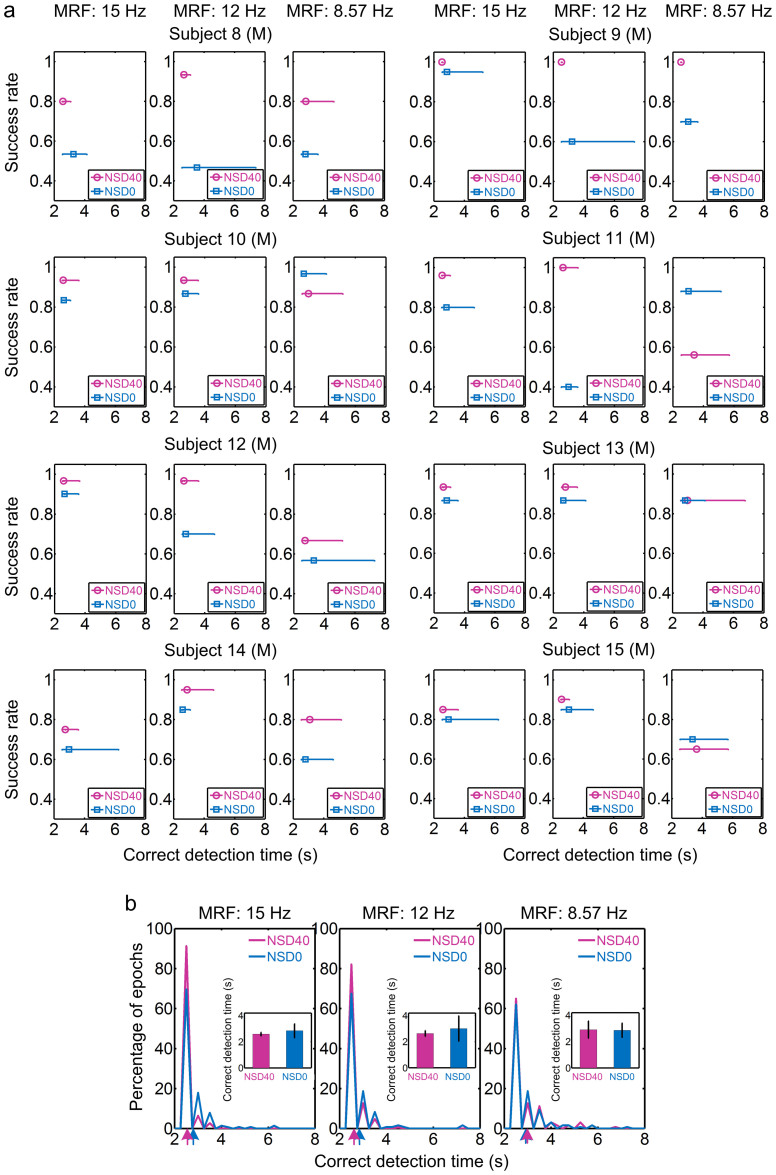
Figure 3. Online success rate and correct detection time under NSD of 40 versus 0 in semi-synchronous online brain-control tasks performed using a CRT monitor.
(a) Online success rate and correct detection time for individual subjects. Results under NSD of 40 are shown in magenta and those under NSD of 0 are in blue. Each error bar characterizes the distribution of correct detection time upon a certain success rate that was calculated as the percentage of correctly judged epochs. The upper and lower bounds of each error bar were set with maxima and minima of the time distribution, and the central point (circle and square) represents the mean. For convenience, the upper end of the ordinate was set above 1. (b) Histograms of detection time of correctly detected epochs across eight subjects. Insets show grand-averaged correct detection time. Arrows below plots mark the mean value for each histogram.

