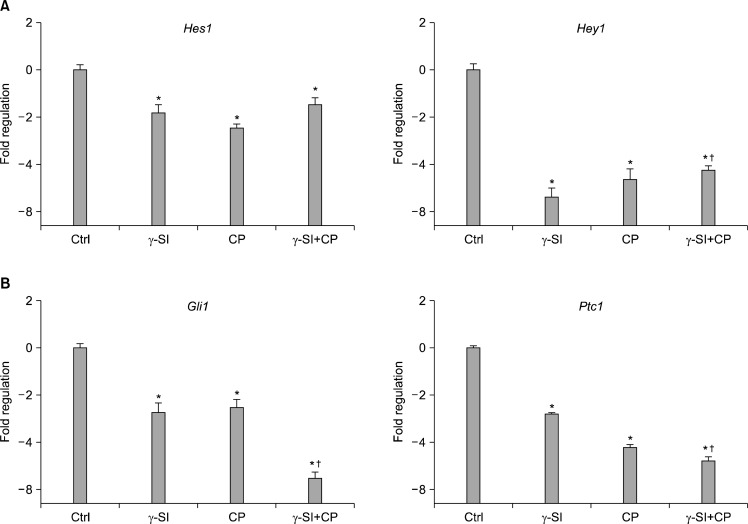
Fig. 3.
Transcriptional activation of downstream genes after Notch and Hh inhibition in hESCs grown in 5% oxygen. The hESC line CLS1 was treated with 1 μM γ-SI, 10 μM CP or their combination, and after 3 weeks the levels of gene-specific messages were determined by a real-time RT-PCR. (A) The expression of Notch effector genes Hes1 and Hey1. (B) The expression of Hh effector genes Gli1 and Ptc1. The values are presented as the mean and the error bars denote the standard error of mean. The normalization was done with respect to the control samples. *Indicate statistical significance (p<0.05) in comparison to the control. †Indicate statistical significance (p<0.05) of the combined treatment compared with single inhibitors.

