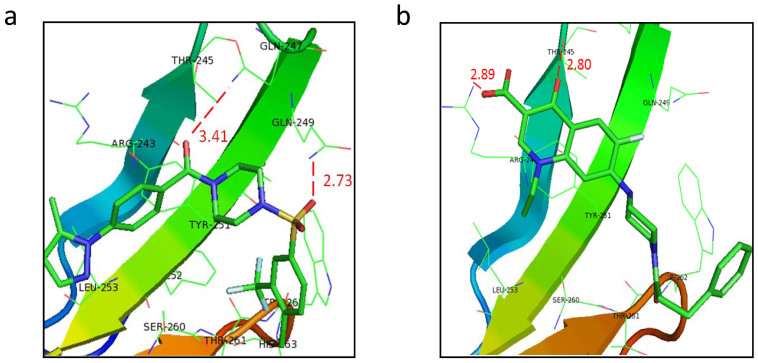
Figure 7. Predicted binding modes of selective compounds to the defined pocket.
(a) Predicted binding modes of A01 with the defined pocket. Important residues in the pocket were labeled in black. The distances (angstrom) of hydrogen bonds donors and receptors were noted in numerical values and red dotted lines. (b) Predicted binding modes of A17 with the defined pocket. Important residues in the pocket were labeled in black. The distances (angstrom) of hydrogen bonds donors and receptors were noted in numerical values and red dotted lines.

