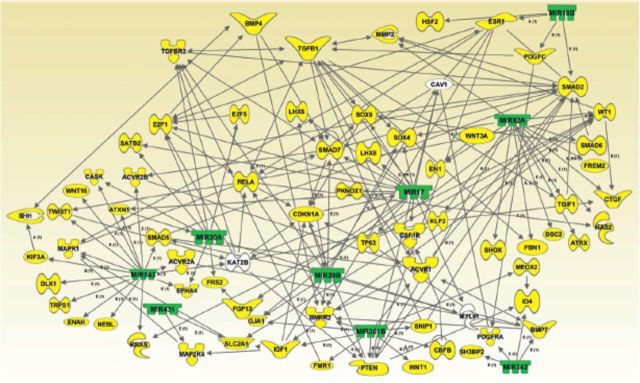
Figure 4.

Computational gene interaction predictions: gene network with microRNAs demonstrating diminished expression in developing orofacial tissue on gestational day (GD) 13 versus GD 12. A network with selected genes encoding microRNAs (green) with decreased expression on GD 13 versus GD 12 developing orofacial tisue and their known or predicted target genes (yellow) critical for orofacial ontogenesis was constructed with ingenuity pathway analysis software and the miRDB (http://mirdb.org/miRDB/) database. Solid lines specify direct relationships, whereas dotted lines indicate indirect interactions (Mukhopadhyay et al. 2010).
