
Figure 3.
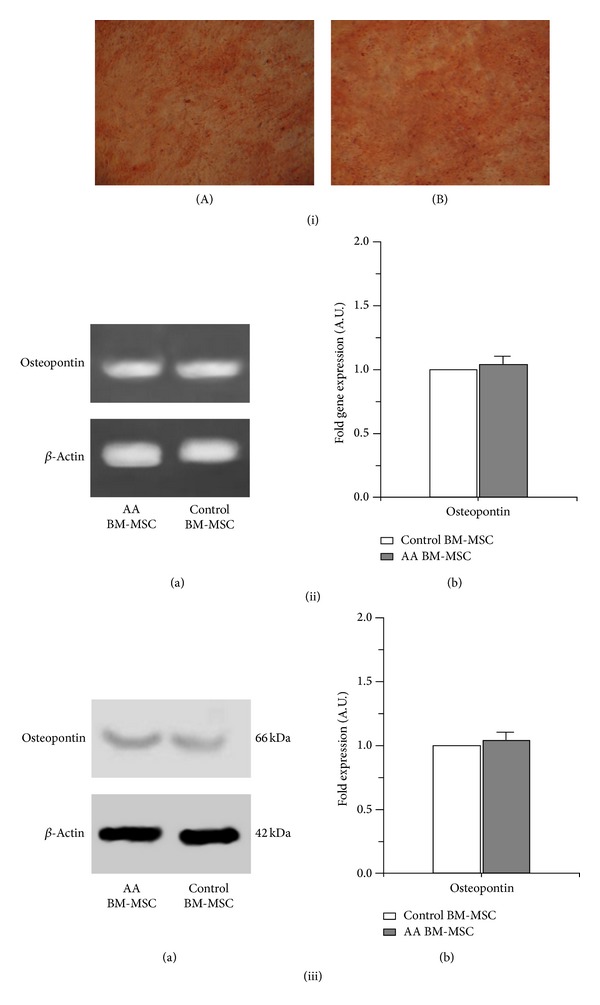
Osteogenic differentiation of BM-MSC of aplastic anemia patients. (i) Alizarin red staining of osteocytes differentiated from BM-MSC of (A) aplastic anemia patients (B) controls (bright field microscope view at 20x). (ii) Gene expression of osteopontin in osteocytes differentiated from BM-MSC of aplastic anemia patients and controls. (a) Representative gel pictures of RT-PCR. (b) Fold gene expression. (iii) Protein expression of osteopontin in osteocytes differentiated from BM-MSC of aplastic anemia patients and controls. (a) Representative Western-blot picture. (b) Fold expression of proteins.