Figure 3.

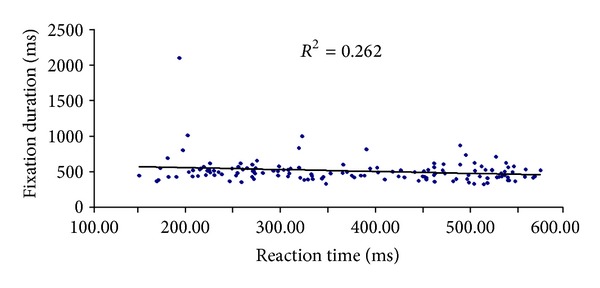
Correlation between gaze parameter and response time in experts' correct responses. Dots represent all participants' mean value for each correct trial. The line represents the regression coefficient (r = −.22, P < .001) for expert groups.

Correlation between gaze parameter and response time in experts' correct responses. Dots represent all participants' mean value for each correct trial. The line represents the regression coefficient (r = −.22, P < .001) for expert groups.