
Figure 11.
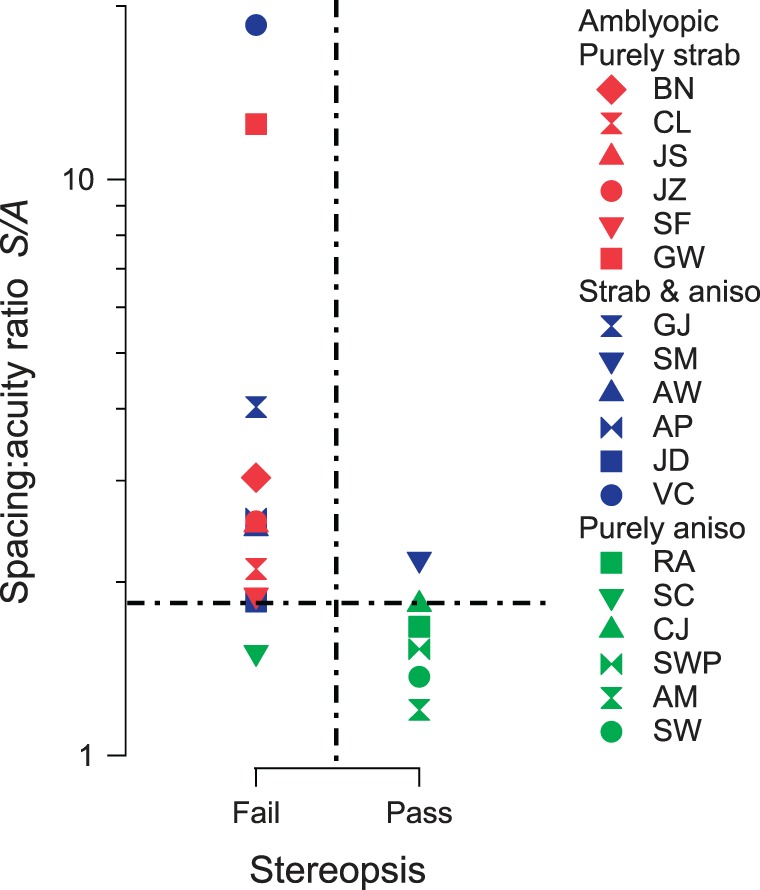
Spacing:acuity ratio versus status of stereopsis for amblyopes. Amblyopes who failed the stereopsis test are plotted as “Fail”; everyone who has some amount of stereopsis is plotted as “Pass.” The vertical dashed line divides the amblyopes into “Fail” and “Pass” groups, and the horizontal dashed line, S/A = 1.84, divides the amblyopes into two groups with large and small spacing:acuity ratio.