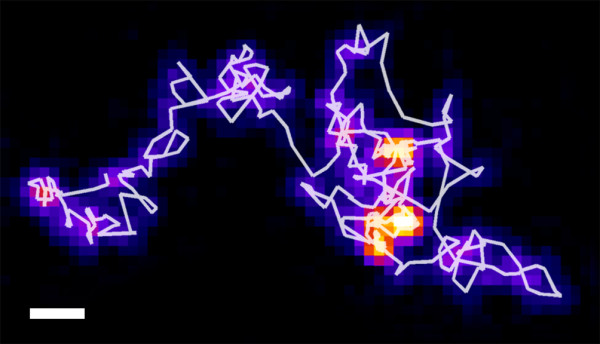
Figure 4.

Sum projection of a single molecule image stack, with color coding for better visualization: brighter color indicates longer time spent by the particle in a certain area. The detected particle trajectory is overlaid on the image. It can be clearly seen that a particle is switching between two states: fast diffusion and slow diffusion. This behavior is typical for most of the observed molecules. Analyzing Particle Movement (APM_GUI) software was used to ensure that the particles remain in a confined region longer than particles undergoing normal Brownian diffusion would remain. Scale bar 1 μm.
