Figure 7.

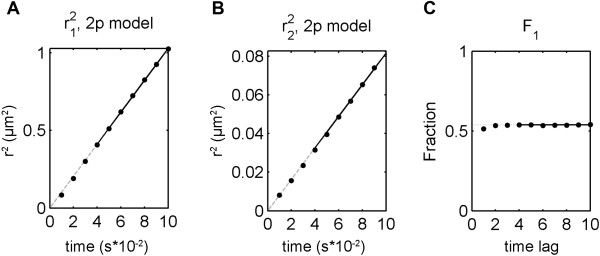
MSD plots. MSD plots for fast (A) and slow (B) populations, and fraction of the fast population (C) calculated for SM-Atto647N diffusing on a mica-supported DOPC membrane at 25°C.

MSD plots. MSD plots for fast (A) and slow (B) populations, and fraction of the fast population (C) calculated for SM-Atto647N diffusing on a mica-supported DOPC membrane at 25°C.