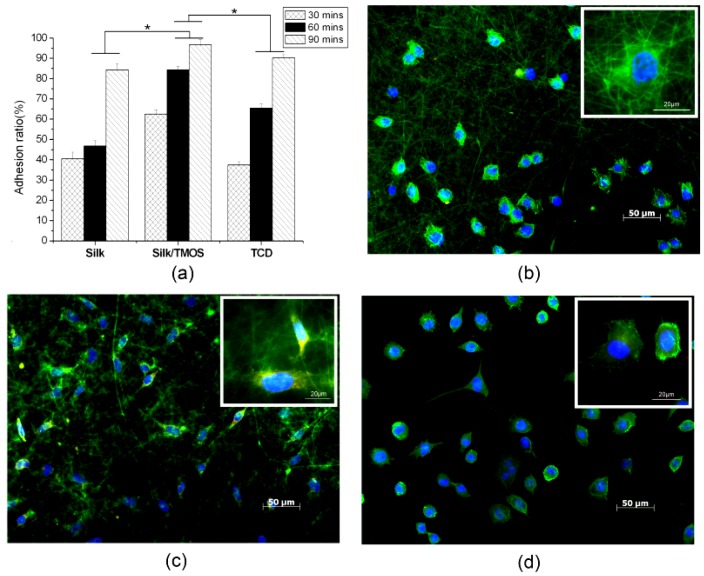
Figure 6.
The adhesion ratio for L929 cells after 90 min culture on pure silk, silk/TMOS nanofibers and tissue culture dishes (TCD) controls (a). Significant difference between different materials groups were denoted as * (p < 0.05). Fluorescent staining of F-actin (green), vinculin (red), and cell nuclei (blue) for L929 cells after 6 h culture on silk: fibrous scaffold (b), silk/TMOS (c), and TCD (d).

