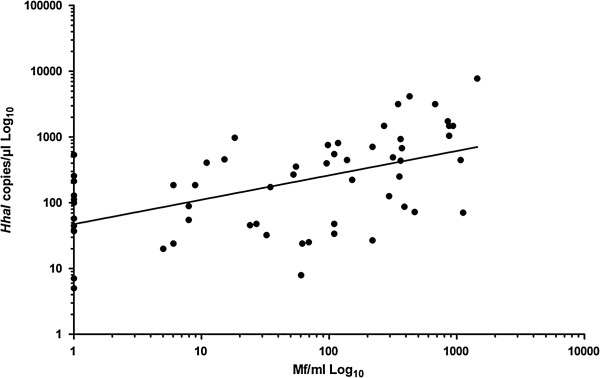
Figure 1.

Determination of a threshold for infection. Mf loads from Mf-positive and LE patients were correlated to HhaI copies/μl (n = 58). Linear regression was performed to calculate the Y-intercept and standard deviation of the line. The threshold was defined as: Y-intercept (47.31) + 4XSD (1.43). Spearman Rank correlation resulted in r = 0.52 with P < 0.001 (PASW 18.0 software package).
