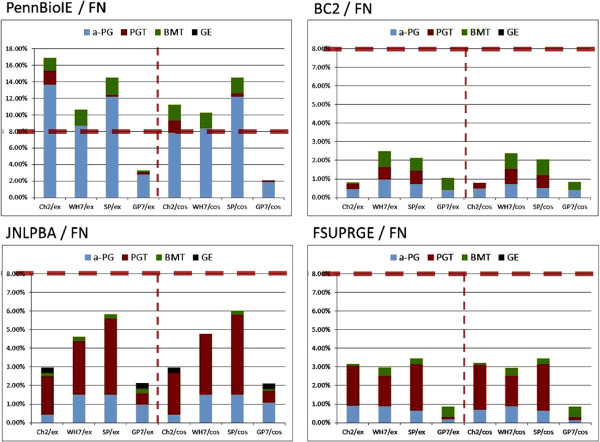
Figure 9.
The diagram displays the portions of FN results of the tagging solutions against the GSCs. The figure visualises the results from Figure 8, where the error frequencies have been normalized by the annotations contained in the GSC. The FN errors in Jnlpba and in FsuPrge are frequently of type PGT, whereas the other two corpora rather produce a-PG FN results. PennBio and Jnlpba appear to be less compliant with the terminological standards of the tagging solutions than the other two corpora. Exact matching and cos98 matching produce very similar results, excluding that the selection of annotation boundaries could be the main source of the FN results.

