Figure 6.

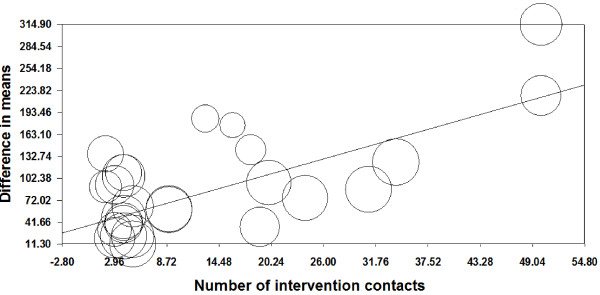
Meta-regression analysis of effects of number of contacts during interventions on fruit and vegetable intakes. Slope = 3.80, Q = 36.93, d.f. = 1, P <0.0001. The circle size reflects the weight that a study obtained in the meta-regression.

Meta-regression analysis of effects of number of contacts during interventions on fruit and vegetable intakes. Slope = 3.80, Q = 36.93, d.f. = 1, P <0.0001. The circle size reflects the weight that a study obtained in the meta-regression.