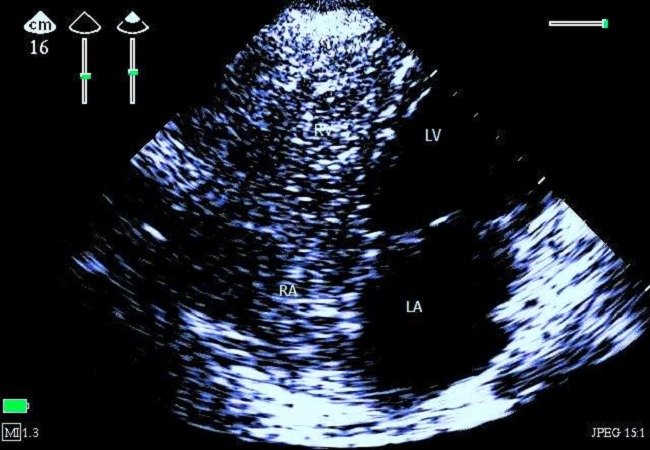
Figure 1.

Apical four-chamber 2D echocardiography centered on the right cavities showing massive gas bubbles, image taken 50 seconds after the onset of clinical signs of embolism. (LA: left atrium, LV: left ventricle, RV: right ventricle, RA: right atrium)
