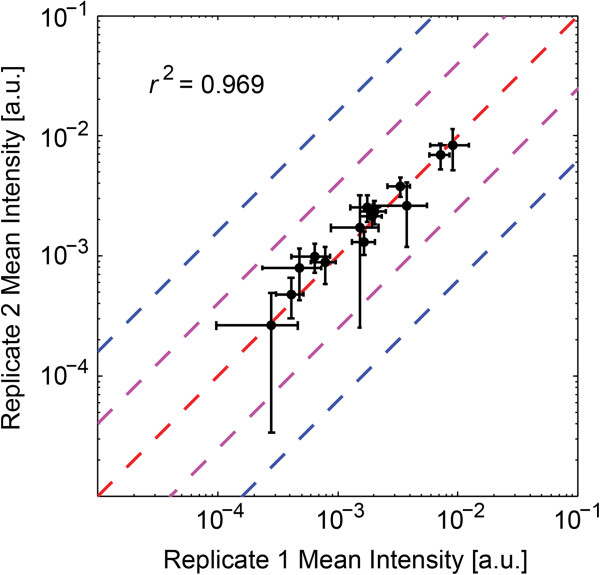
Figure 3.
Comparison of mean preprocessed ion intensities and 95% confidence intervals between replicate experiments of WT flies for the fourteen isotope distributions identified by MALDI-TOF/TOF MS/MS to be neuropeptides. Linear regression between the mean values of the fourteen isotope distributions gave an R2 = 0.969. The dashed red line shows where mean intensity values should be had they been identical between the two repeat experiments. The dashed purple and blue lines show where the log2 ratio between two conditions would be 1 or 2, respectively. 95% confidence intervals in either experiment generally were within 1 log2 ratio.

