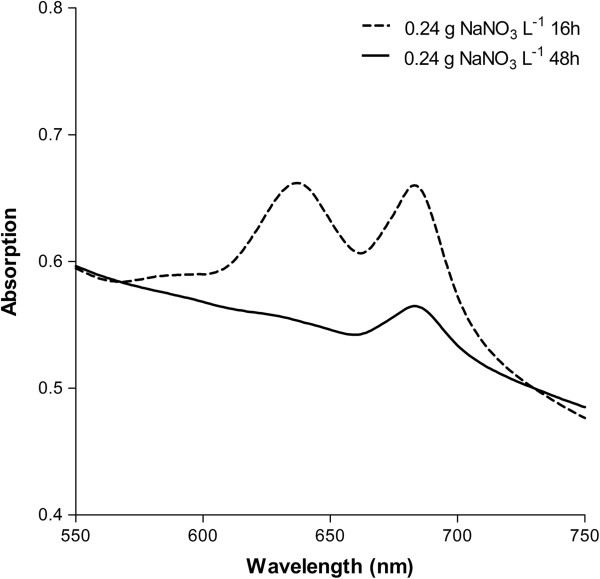
Figure 2.
Absorption spectra of intact Synechococcus cells. Nitrate-replete cells (at 16 hours with 0.24 g NaNO3 L-1; dashed line) and nitrate-limited cells (at 48 hours with 0.24 g NaNO3 L-1; solid line). The spectra were recorded in dilute cell suspensions (OD730 = 0.3 to 0.4) and normalized to an OD730 of 0.5. The peak at 637 nm is due to phycobilisomes and the peak at 683 nm is due to chlorophyll a. OD730, optical density at 730 nm.

