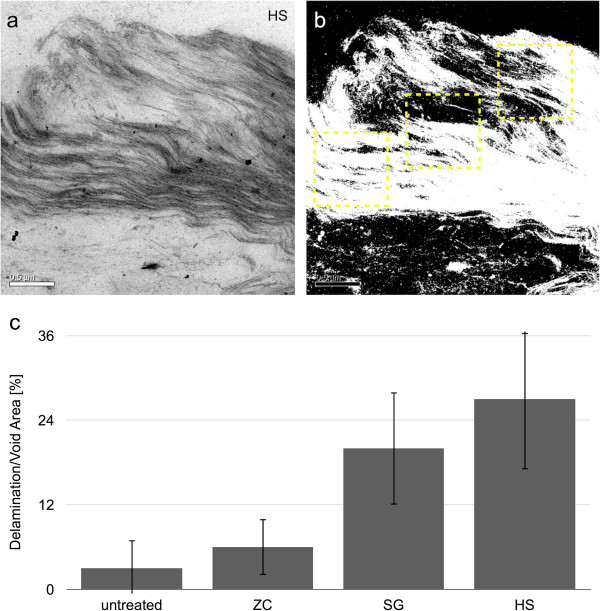
Figure 6.
Determination of delamination and void area from TEM micrographs. (a) TEM micrograph of a region of cell wall from the HS reactor sample. (b) A binary version of the same image that delineates delamination/pore areas and also shows how representative intramural ROIs were chosen. (c) Delamination/pore areas measured by image analysis and presented as a percent of the measured area. HS, horizontal screw; ROI, region of interest; SG, steam gun; TEM, transmission electron microscopy; ZC, ZipperClave®.

