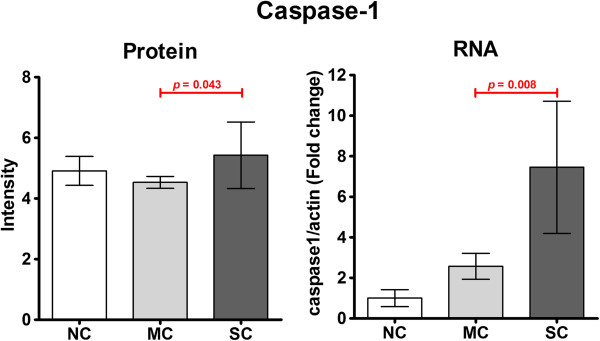
Figure 4.

Quantitation of caspase 1 expression. The relative expression level of pro-caspase 1 protein was determined from peptide intensity data (after normalization) in the gel slice centered on 45 kDa [as shown in Additional file 1: Figure S1], while expression levels of caspase 1 mRNA were determined by real time RT-PCR.
