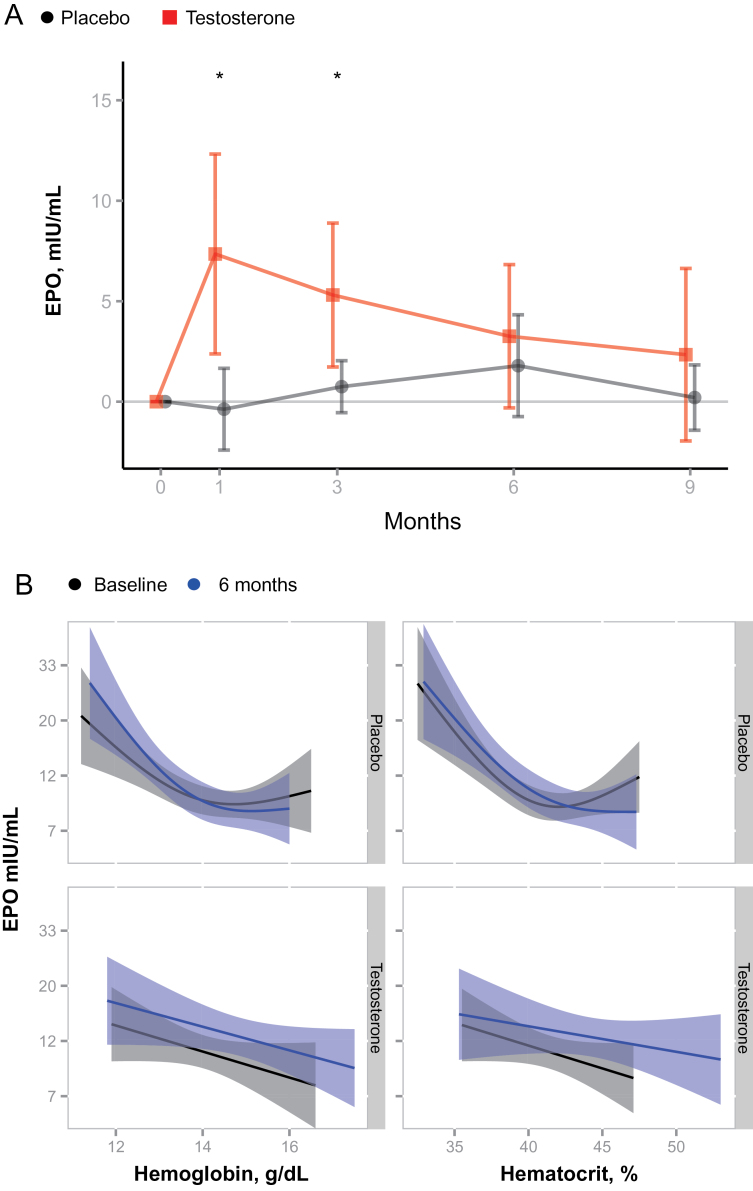
Figure 3.
(A) Changes in erythropoietin (EPO) levels during testosterone or placebo administration. EPO levels increased significantly during treatment with testosterone compared with placebo. Mean and 95% CIs are shown. *p < .05 for comparison between the placebo and testosterone groups. (B) Testosterone administration shifts the log EPO to hemoglobin and log EPO to hematocrit curves, whereas placebo had no effect on this relationship. Fitted curves and 95% confidence regions are depicted (obtained by generalized additive models). The vertical shift in the top two panels indicates increased EPO per hemoglobin or hematocrit at end of testosterone treatment. No such shift is observed for placebo.

