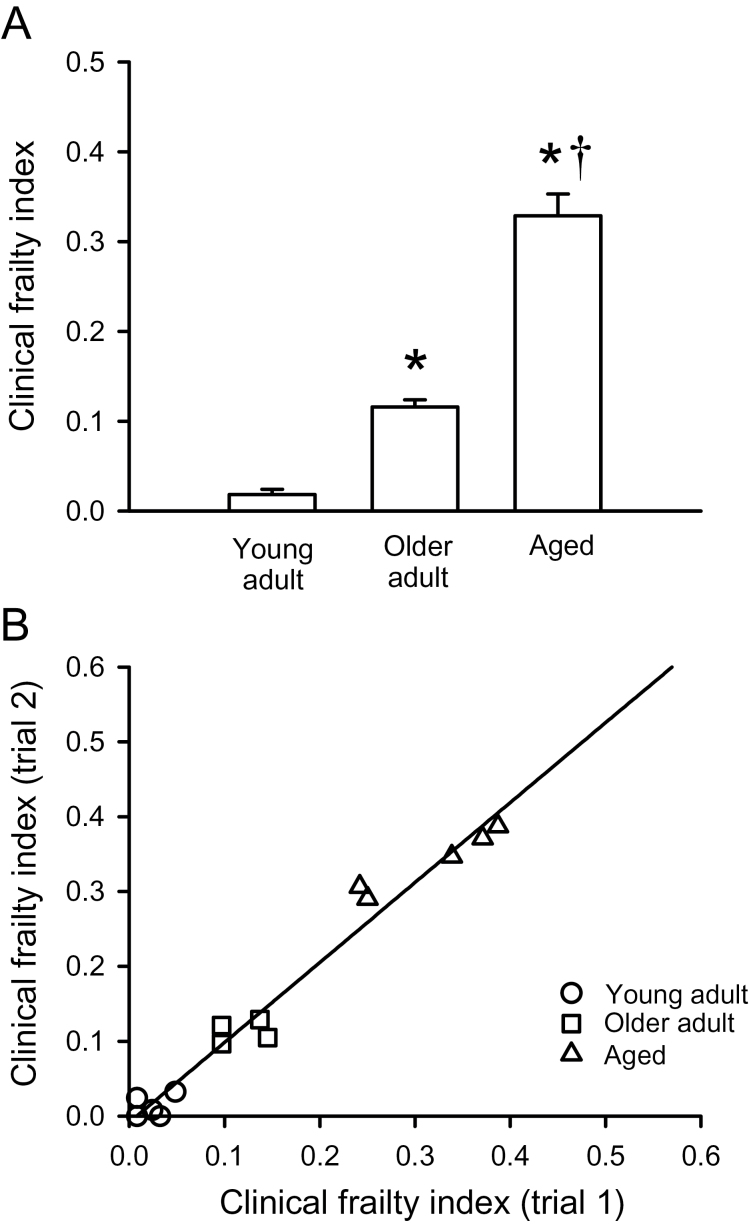
Figure 3.
Scores obtained with the clinical frailty index. (A) Mean (± SEM) clinical frailty index scores increased with age. (B) The clinical frailty index scores from trial #1 were plotted against those from trial #2. These data were fitted with a linear regression (r 2 = .97; p < .0001; n = 5 young adult mice, 4 older adult mice, and 5 aged mice). *Indicates significantly different from young adults; †Indicates significantly different from older adults (p < .05).

