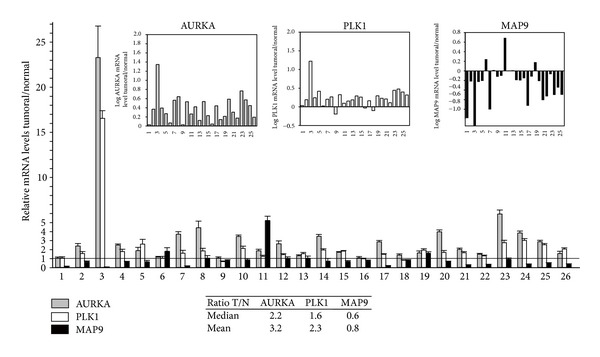
Figure 1.

MAP9, AURKA, and PLK1 mRNA levels in colorectal cancer. The mRNA levels were measured by real-time PCR from RT-PCR reactions of 26 colorectal tumors and adjacent normal tissue (numbered 1 to 26 on the x-axis). Individual values were normalized to four control genes. Results are expressed as relative mRNA levels (ratio tumor/normal tissue, T/N). The horizontal line for a ratio = 1 indicates the limit for under- or overexpression of the three genes in the 26 tumor samples. In the insets, a logarithmic representation of the mRNA levels of the 26 samples illustrates MAP9 underexpression and AURKA and PLK1 overexpression. A table (inset) recapitulates the arithmetic means and medians of the T/N ratios for the three genes. Differences of gene expression between tumors and normal tissues are statistically significant with P < 0.001 for the 3 genes.
