
Figure 3.
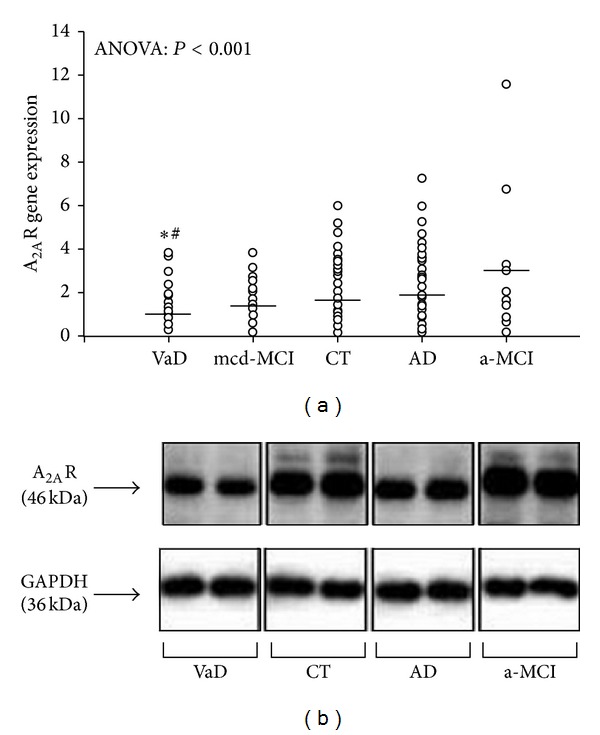
(a) Scatter plot of A2A gene expression in PBMCs from VD, mcd-MCI, controls (CT), AD, and a-MCI subjects (the lines represent the mean value for each group). *P < 0.001 versus AD; # P < 0.05 versus a-MCI. (b) Representative picture of the western blot analysis of the A2A densities in PBMCs extracts, running in duplicate, from one subject from the VD, CT, AD, and a-MCI groups, respectively.