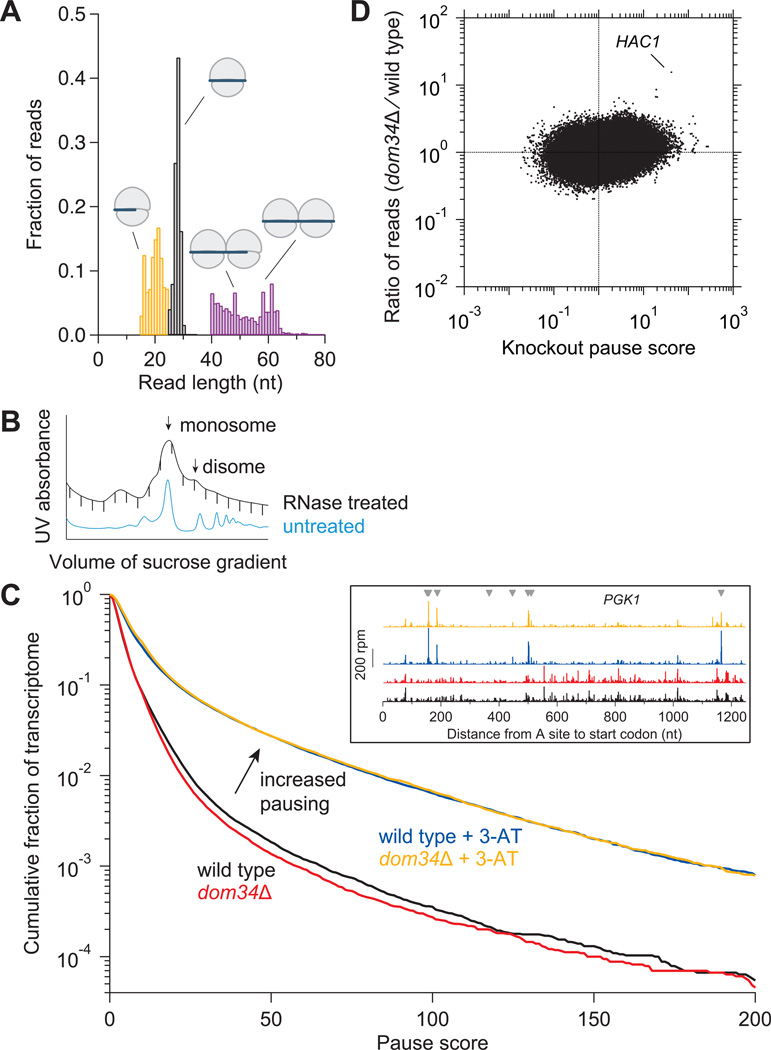
Figure 1. Analysis of Ribosome Footprint Size and Pausing.
(A) Size distributions of untrimmed ribosome footprints that mapped without mismatches to the genome or splice junctions. Short monosome-protected fragments (15–24 nt, orange), long monosome-protected fragments (25–34 nt, black), and disome-protected fragments (40–80 nt, purple). Each distribution came from a separate sample and thus sums to 1.0. Black and purple distributions obtained from wild-type cells and orange from ski2Δ cells.
(B) Sucrose gradient profile for dom34Δ yeast showing both RNase-treated and untreated control samples. Monosome and disome peaks are indicated.
(C) Effect of DOM34 knockout and 3-AT on ribosome pausing. Cumulative histogram of pause score values (smoothed reads at a position / median reads in gene) computed for all positions in the transcriptome with adequate read density. (Inset) Ribosome footprint reads that map to an example gene (PGK1). Histidine codons are marked with gray arrowheads.
(D) Enrichment ratio of reads mapped at single nucleotide positions in the dom34Δ strain compared to the wild-type strain shown as a function of knockout pause score (smoothed reads at a position / average reads in gene) for all positions in the transcriptome with adequate read density. Sites where pauses are amplified by knockout of DOM34, such as on HAC1, are located in the upper right quadrant.
See also Figures S1, S2, and S6.

