
Figure 3.
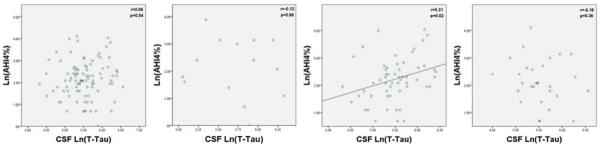
Graphs of AHI4% and Natural Log of CSF T-Tau for all subjects (n=95), ApoE 2+ subjects (n=14), ApoE3+ subjects (n=56), and ApoE4+ subjects (n=29).
Y Axis: Natural Log of AHI4%; X Axis: Natural Log of CSF levels of T-Tau
Official websites use .gov
A
.gov website belongs to an official
government organization in the United States.
Secure .gov websites use HTTPS
A lock (
) or https:// means you've safely
connected to the .gov website. Share sensitive
information only on official, secure websites.
Graphs of AHI4% and Natural Log of CSF T-Tau for all subjects (n=95), ApoE 2+ subjects (n=14), ApoE3+ subjects (n=56), and ApoE4+ subjects (n=29).
Y Axis: Natural Log of AHI4%; X Axis: Natural Log of CSF levels of T-Tau