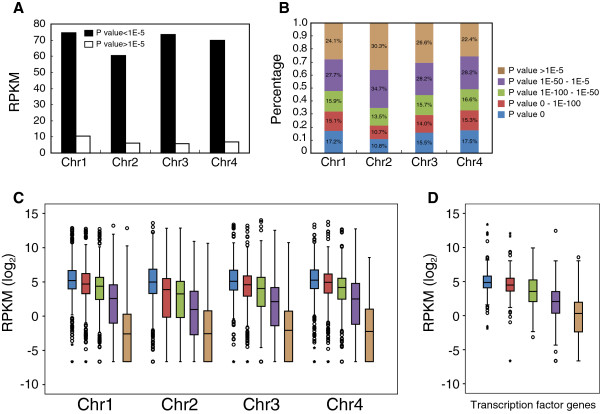
Figure 4.

Gene expression levels in relation to their degree of similarity. (A) The expression levels of genes with orthologs (p value < 1E-5) or genes without orthologs (p value > 1E-5) in F. verticillioides were quantified by their RPKM values. (B) Genes were categorized into five groups according to their degree of similarity with those of F. verticillioides (p value 0, 0 - 1E-100, 1E-100 - 1E-50, 1E-50 - 1E-5 and >1E-5). The proportion of each category of genes on each chromosome was calculated. (C) Box plot analysis of the expression of genes on each chromosome according to their degree of similarity with those of F. verticillioides. Log2-transformed RPKM values were used to evaluate gene expression levels. (D) Box plot analysis of the expression of 710 transcription factor genes (as identified by Son et al., 2011) according to the degree of similarity with those of F. verticillioides. Log2-transformed RPKM values were used to evaluate gene expression levels.
