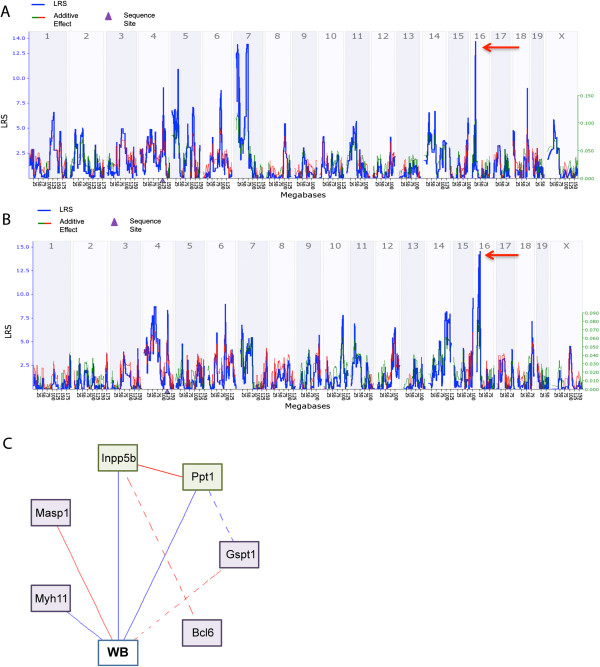
Figure 4.

Correlations and networks for genes in TM4 and TM16 . (A) Interval map for Ppt1 gene expression. This TM4 gene modulates gene expression in the TM16 region (red arrow). (B) Interval map for the TM4 gene Innpb5 that also modulates gene expression in the TM16 region (red arrow). (C) Hypothetical gene network modulating worm burden based on gene correlations between TM4 and TM16. Solid blue lines represent correlations between -0.7 and -0.5, broken blue lines between -1.0 and -0.7. Solid and broken red lines represent the equivalent positive correlations. Phenotypes are in white boxes; TM4 genes are in green boxes whilst TM16 genes are in purple boxes. p ≤ 0.01 in all cases.
