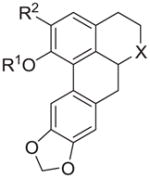
Table 1.
Ke values for analogs at 5-HT2A and α1A receptors
| Compd. | R1 | R2 | X | Ke ± SEMa (nM)
|
Selectivity 5-HT2A/α1A | ||
|---|---|---|---|---|---|---|---|
| 5-HT2A | α1A | ||||||

|
12a | H | H | NMe | >3000 | 2950 ± 457 | <1.01 |
| 12b | allyl | H | NMe | 47 ± 5 | 744 ± 74 | 0.06 | |
| 14 | H | allyl | NMe | >3000 | >3000 | - | |
| 15a | Me | allyl | NMe | 485 ± 123 | 566 ± 112 | 0.85 | |
| 15b | allyl | allyl | NMe | 1374 ± 405 | >3000 | <0.45 | |
| 15c | cyclopropylmethyl | allyl | NMe | 963 ± 103 | >3000 | <0.32 | |
| 16a | Me | OMe | O | >3000 | >3000 | - | |
| 16b | allyl | OMe | O | >3000 | >3000 | - | |
| (R)-1 | Me | OMe | NMe | 946 ± 61 | 70 ± 10 | 13.5 | |
| (S)-1 | Me | OMe | NMe | 657 ± 89 | 196 ± 3 | 3.4 | |
| ±-(1)b | Me | OMe | NMe | 850 ± 6 | 36 ± 7 | 23.6 | |
| 2c | allyl | OMe | NMe | 70 ± 15 | >10000 | <0.007 | |
| 3d | cyclopropylmethyl | OMe | NMe | 68 ± 8 | >10000 | <0.007 | |
| prazosin | - | - | - | - | 1.1 ± 0.4 | - | |
| ketanserinb,e | - | - | - | 32 | - | - | |
