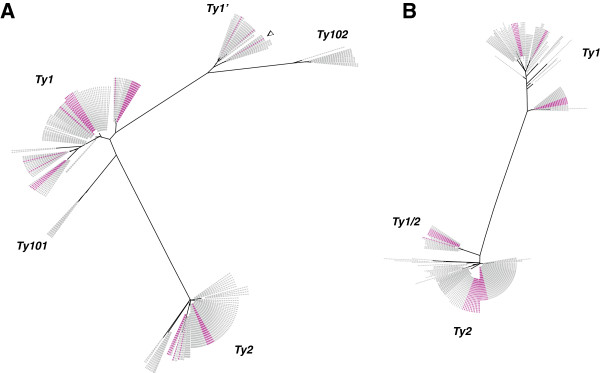
Figure 4.

Ty1 and Ty2 coding-element subfamilies. Phylogenic trees were drawn up, based on 300 aligned nucleotide positions. Individual sequence names have been omitted. Branches are drawn to scale. Pink-colored leaves correspond to sequences detected in the strain S288c. Grey leaves correspond to sequences detected in all the remaining strains. The corresponding Ty family or subfamily is indicated for the clusters. The arrowhead indicates the Ty1’ relic copy. A) TYA300 neighbor joining tree based on the 300 nucleotides, in line with the 5′ LTR and the distribution of elements in the strain S288c. B) TYB300 neighbor joining tree based on the 300 nucleotides preceding the 3′ LTR and the distribution of elements in the strain S288c.
