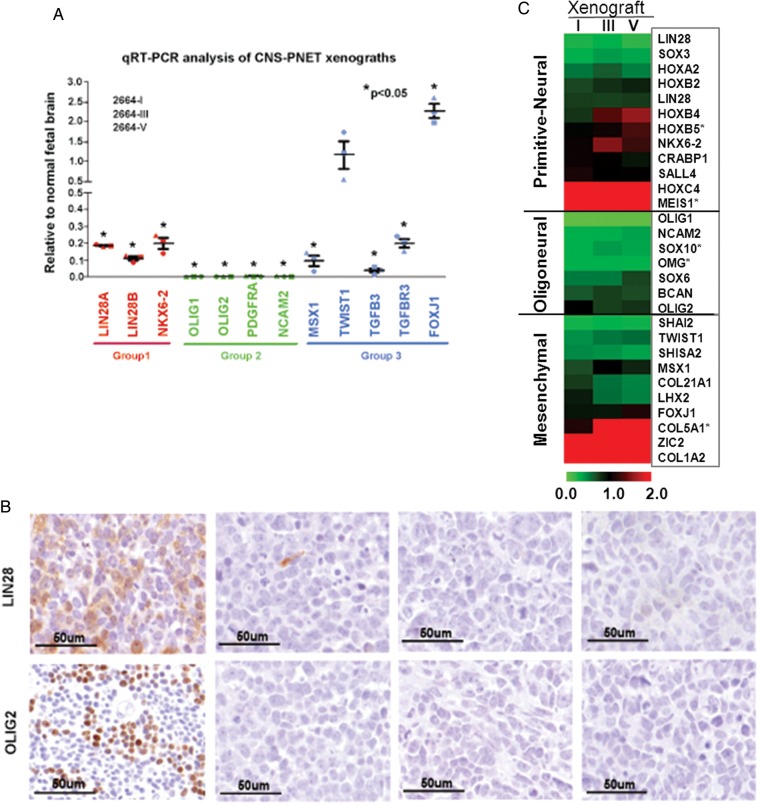
Fig. 2.
Molecular subgrouping of IC-2664PNET xenografts. (A) Quantitative RT-PCR analyses of 3 CNS-PNET xenografts, 2664-I, 2664-III and 2664-V, using group-specific PNET cell lineage markers. Data are shown as mean expression relative to fetal brain of 3 independent replicas. Error bars represent the SEM. (B) Immunohistochemical analyses of the 3 xenograft tumors (from passages I to V) showing double-negative staining of the group 1 marker LIN28 and group 2 marker OLIG2. (C) Hierarchical cluster map of cell lineage markers during serial subtransplantations in vivo in mouse brains.

