
Fig. 3.
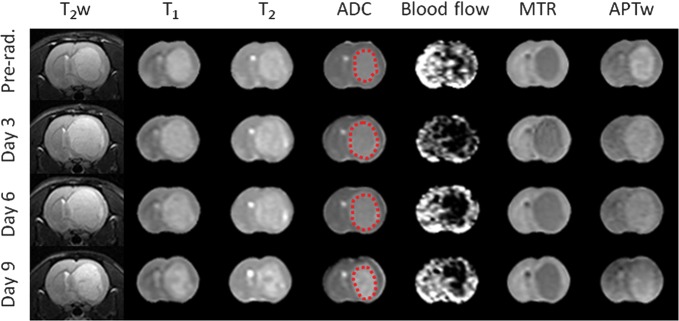
Changes in T2w, T1, T2, ADC, blood flow, MTR, and APTw images acquired at the different time points (preradiation and at 3, 6, and 9 d postradiation) for a rat with a U87MG glioma. The display windows are T1 (0.5–2 s), T2 (0–100 ms), ADC (0–2 × 10⁻⁹ m2/s), blood flow (0–200 mL/100 g/min), MTR at 2 kHz (0%–50% of the bulk water signal intensity), and APTw (−10% to 10% of the bulk water signal intensity).