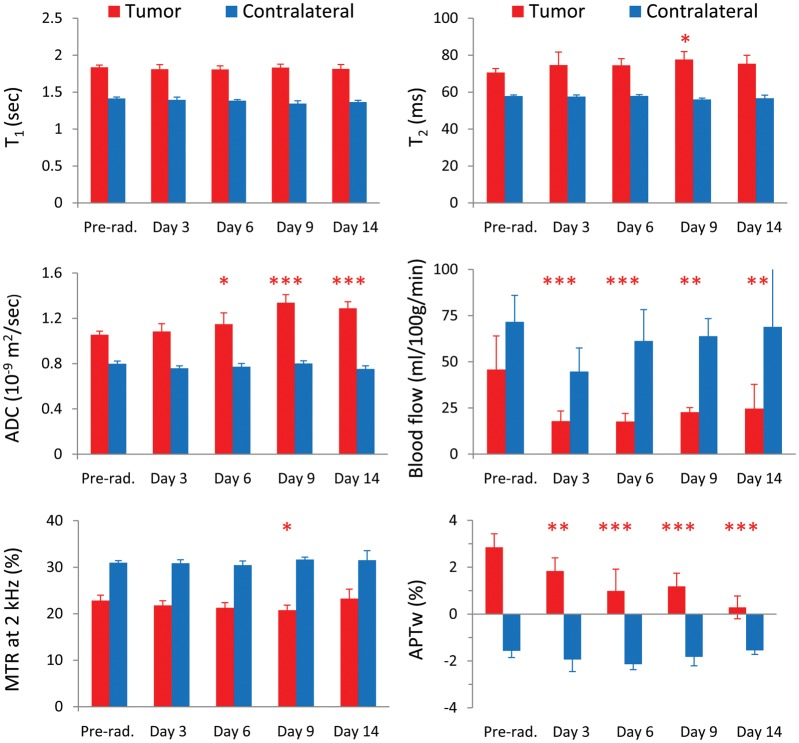
Fig. 4.
Quantitative analysis of multiparametric MRI signal intensities at the different time points (preradiation and at 3, 6, 9, and 14 days postradiation) for the irradiated tumors (40 Gy) and the contralateral normal brain tissue (n = 10). The statistical significance of the difference compared with preradiation: *P < .05, **P < .01, ***P < .001, not marked = not significant.

