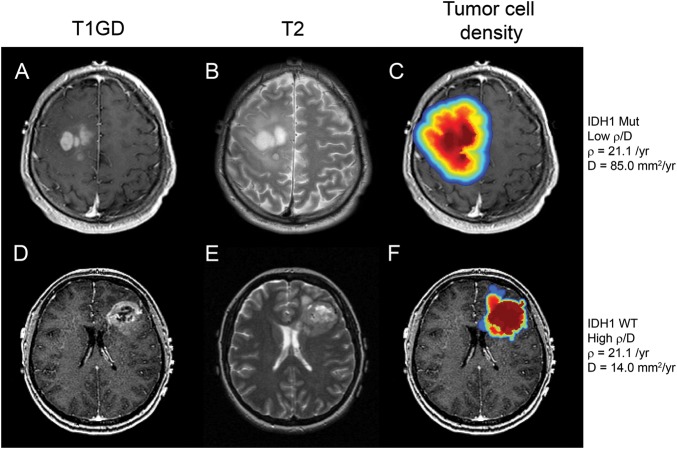
Fig. 1.
MRI scans from 2 patients with similar ρ values, one that is mutant for IDH1 (top row: A,B,C) and one that is IDH1 wild-type (bottom row: D,E,F). All 6 images are pretreatment scans; A and D are T1Gd images, B and E are T2 images, and C and F are false-color images representing tumor cell density overlaid on the T1Gd scans (red, highest cell density; blue, lowest cell density). The growth parameters associated with these GBMs are ρ = 21.1/year, D = 85.0 mm2/year, with ρ/D = 0.25/mm2 for the IDH1mut tumor and ρ = 21.0/year, D = 14.0 mm2/year, ρ/D = 1.5/mm2 for the IDH1wt tumor. The figure illustrates the more diffuse nature of the IDH1 mutant tumor (top row) versus the wild-type (bottom row).

