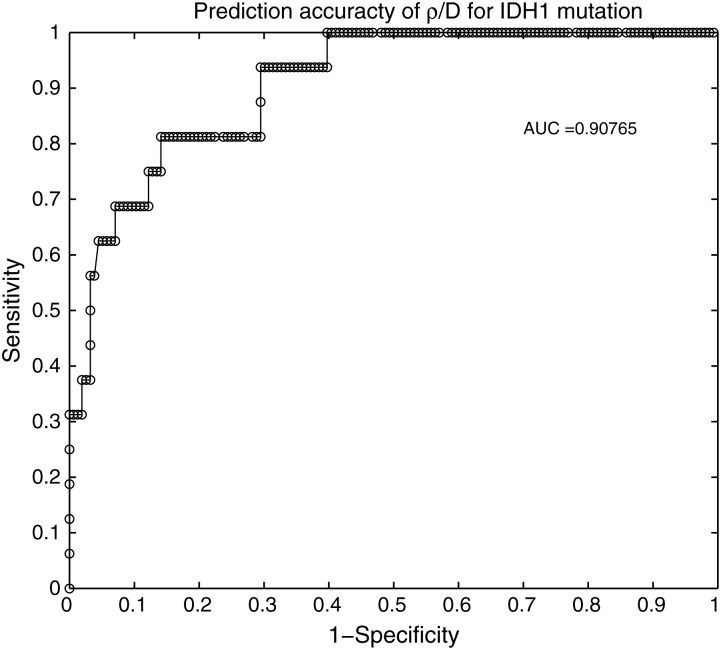
Fig. 6.
Receiver operating characteristic (ROC) analysis of ρ/D as a predictor of IDH1 mutation status. True positive rate versus false positive rate for various cutoff values of ρ/D are tested and plotted as sensitivity (y-axis) and an indicator of specificity (x-axis). The resulting area under the curve (AUC) is 0.90765, where an AUC of 1.0 indicates a predictive accuracy of 100%.

