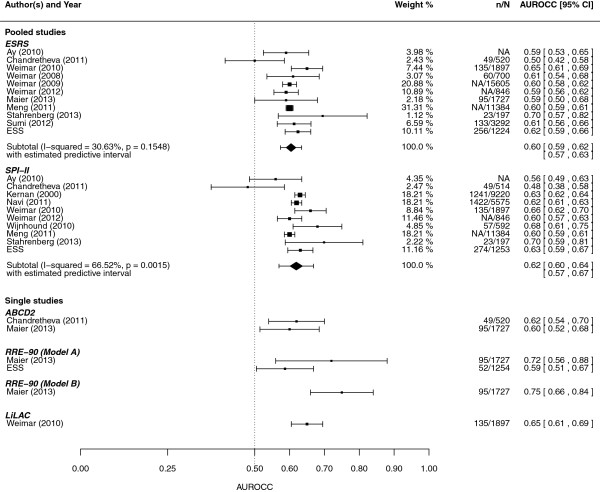
Figure 3.
Meta-analysis of AUROCC values for ESRS and SPI-II (percentage weights are from random effects analysis). N = sample size, n = number of events in follow-up, and NA missing information. AUROCC, area under the receiver operating characteristic curve; ESRS, ESSEN Stroke Risk Score; SPI-II, Stroke Prognosis Instrument II.

