Figure 1.

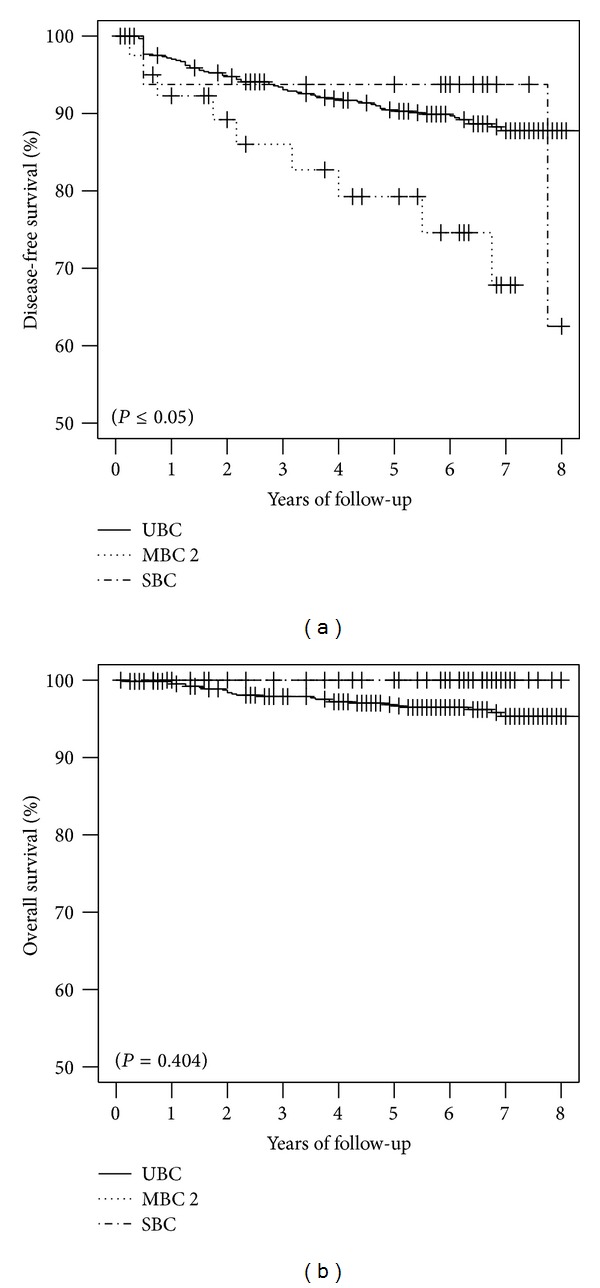
Kaplan-Meyer curves and P values calculated by log-rank test. We have on the left side the curves of disease free survival and on the right side the curves of overall survival.

Kaplan-Meyer curves and P values calculated by log-rank test. We have on the left side the curves of disease free survival and on the right side the curves of overall survival.