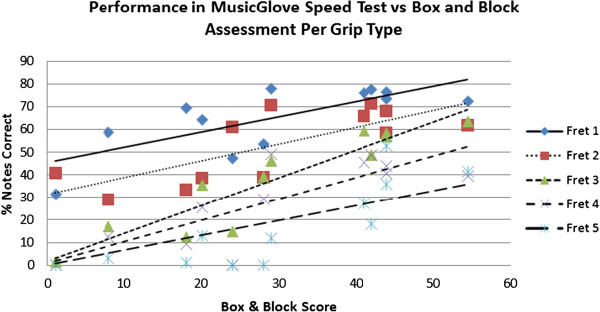
Figure 8.

Comparison of the% notes hit correct during the Speed assessment with B & B score. All five grip types were strongly correlated with B & B score. Data points represent the average of each participant’s Speed assessment performance over the course of the six training sessions.
