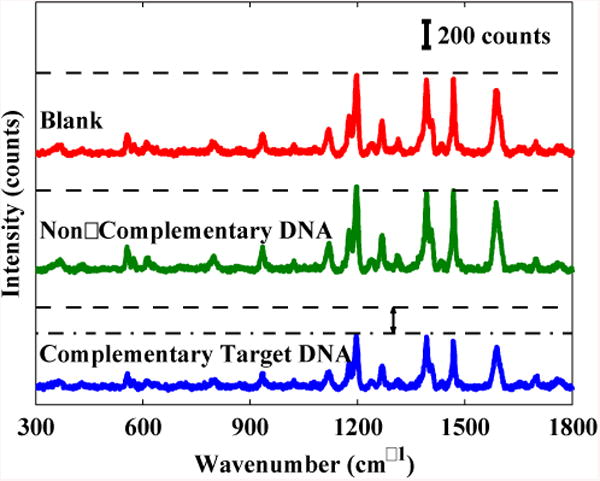
Figure 5.

SERS spectra from blank sample, non-complementary DNA sample, or complementary target DNA sample 2 hours after delivery on MS-functionalized MFON substrates. The dashed lines mark the blank sample's SERS intensity. The dash-dot line marks the complementary target DNA sample's SERS intensity.
