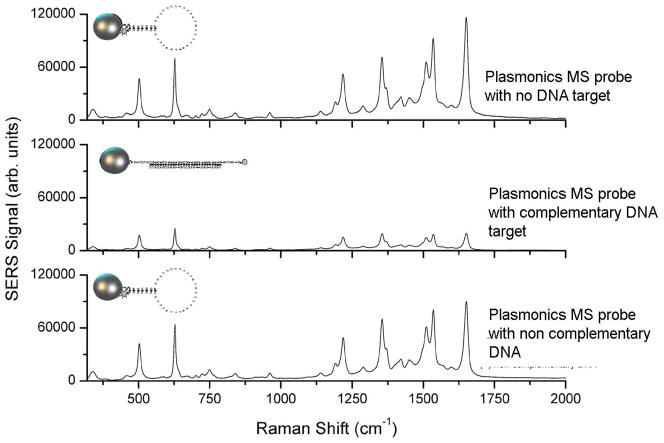
Fig. 5.
SERS spectra of HIV-1 plasmonics MS nanoprobe with no target DNA sequence (top curve) and in presence of a noncomplementary DNA target sequence (negative diagnostic: bottom curve) and a complementary HIV-1 DNA target (positive diagnostic: middle curve) (Adapted from [26]).

