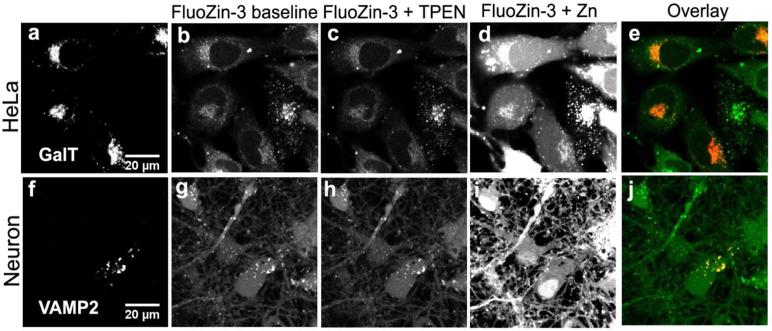
Figure 1. Localization of FluoZin-3 in HeLa cells and cultured cortical neurons.
Fluorescence image of mCherry-GalT Golgi marker in HeLa (a) and mCherry-VAMP2 in neurons (f). FluoZin-3 staining at rest in HeLa (b) and neurons (g), after treatment with 100 μM TPEN (c, h), and after incubation with 100 μM ZnCl2 and 5 μM pyithione (d, i). Overlay of Golgi (red) with FluoZin-3 (green) for HeLa (e) and VAMP2 (red) with FluoZin-3 (green) for neurons (j). Threshold of images at low zinc level (b,c and g,h) is adjusted lower than images for zinc saturation (d, i) to enable visualization with naked eyes. Images b and c are thresholded at the same level, and g and h are thresholded at the same level.

