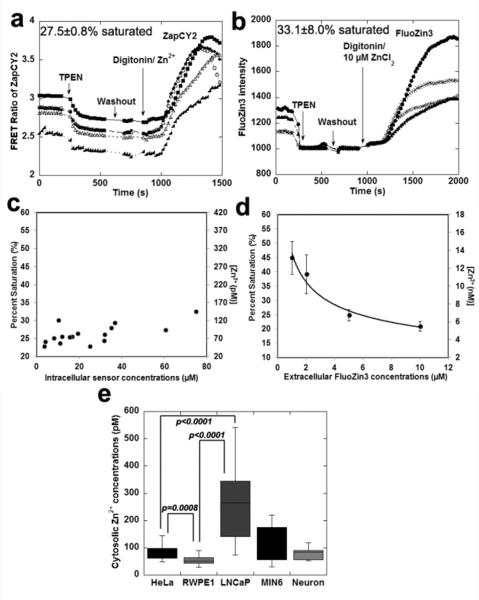
Figure 2. Reduced signal variability and zinc buffering of ZapCY2 compared to FluoZin-3.
a) HeLa cells expressing ZapCY2(a) or loaded with FluoZin-3 (b) and subjected to calibration. Percent saturation of ZapCY2 and estimated [Zn2+] at rest as a function of intracellular [sensor] (c) and for FluoZin-3as a function of the extracellular [FluoZin-3] used to treat cells (fit to an exponential decay) (d). Intracellular [FluoZin-3] is typically ~100x higher than the extracellular concentration. Data are from 6 cells at each concentration. e) Cytosolic [Zn2+] in different cell types. Box represents middle quartiles and whiskers represent upper and lower quartile (full statistics in Table S2).

