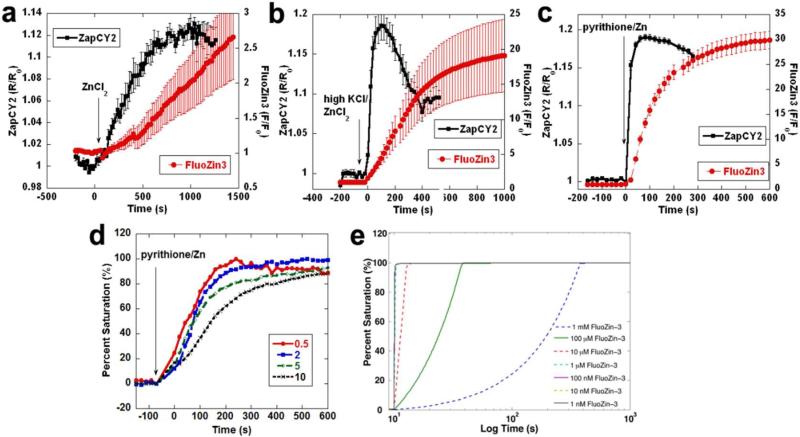
Figure 3. Comparison of the temporal response of FluoZin-3 and ZapCY2 in MIN6 cells.
The increase in intracellular Zn2+ was induced by incubation with 100 μM ZnCl2 (a), 50 mM KCl and 100μM ZnCl2 (b), or 5 μM pyrithione and 100 μM ZnCl2 (c). MIN6 cells loaded with 0.5 μM, 2 μM, 5 μM or 10 μM FluoZin-3 were treated with pyrithione/100 μM ZnCl2 (d). Data are reported as saturation percentage [(F-F0)/(Fmax-F0)%]. Each plot represents the average and S.E.M. of at least five cells. (e) Simulation of Zn2+ binding kinetics of FluoZin-3. In this simulation model, higher concentrations of FluoZin-3 would take longer time to reach the saturation.

