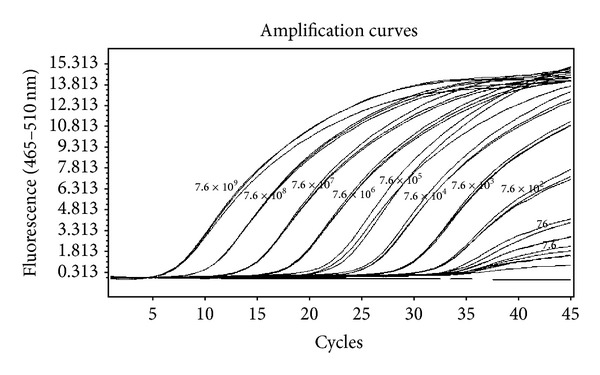
Figure 1.

Amplification curves of 10-fold serial dilution of CCHFV IVT-RNA ranging from copy number 7.6 × 10⁹ to 7.6 using MB rRT-PCR. X-axis represents the cycle number and Y-axis represents the fluorescence acquired at 465–510 nm. The curve shows logarithmic amplification of IVT-RNA dilutions. The numbers on the curves represent the copies of CCHFV IVT-RNA.
