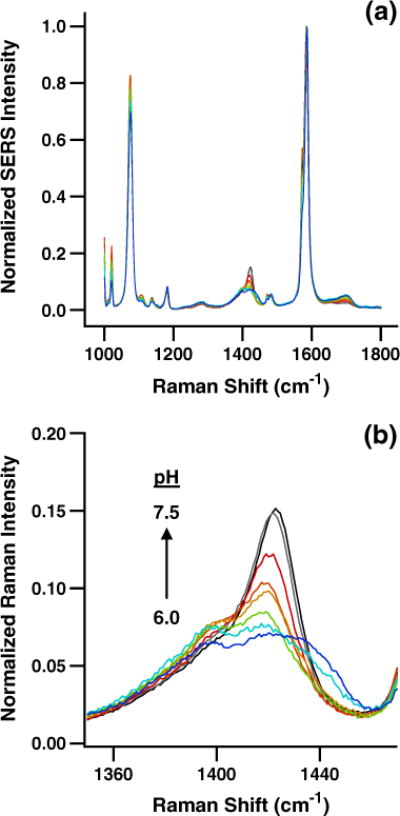
Fig. 1.

pH calibration data for the pH-sensitive nanoprobe. a SERS spectra of pMBA anchored to the AgIF on the submicron-diameter fiber-optic nanoprobe from pH 6.0 to pH 7.5. b The intensity of the ~1,425 cm−1 carboxylate band for pMBA varies with pH across the physiological range due to its degree of protonation/deprotonation
