
Fig. 2.
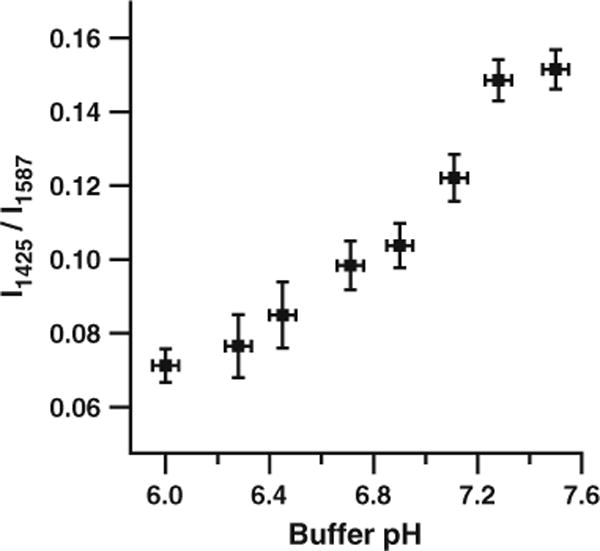
Calibration of the pH-sensitive nanoprobe. A pH calibration curve can be generated using the intensity of the ~1,425 cm−1 pMBA carboxylate band relative to the intensity of the ~1,587 cm−1 combination band. Error bars represent two standard deviations in the y dimension and the resolution of the pH meter in the x dimension