
Figure 10.
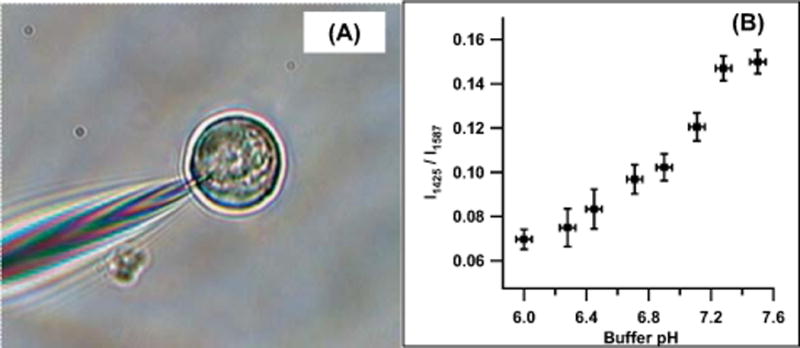
(online color at: www.biophotonics-journal.org) (A) Nanoprobe interrogation and analysis of a single living cell. (B) pH Calibration curve for the pH-sensitive nanoprobe (adapted from Ref. [47]).
Official websites use .gov
A
.gov website belongs to an official
government organization in the United States.
Secure .gov websites use HTTPS
A lock (
) or https:// means you've safely
connected to the .gov website. Share sensitive
information only on official, secure websites.
(online color at: www.biophotonics-journal.org) (A) Nanoprobe interrogation and analysis of a single living cell. (B) pH Calibration curve for the pH-sensitive nanoprobe (adapted from Ref. [47]).